
Skip to content
Neundorfer 50 Year Anniversary Logo
Home Knowledge Base How to Read Your Precipitator’s Warning Signs Before They Become Outage Events

How to Read Your Precipitator’s Warning Signs Before They Become Outage Events

Maintenance

KEY TAKEAWAYS

  • Read the Entire Precipitator: Secondary current usually rises and spark rates often fall from inlet to outlet. Read voltage alongside these trends, controller limits, and the unit’s operating baseline.
  • Separate Process from Equipment: Similar changes across multiple fields suggest a process influence. A persistent outlier in one field or chamber directs attention toward local equipment, controls, or gas distribution.
  • Use Timing to Find the Cause: Align electrical trends with process conditions, emissions, rapper events, hopper status, and purge-air performance to decide where to investigate first.

Unplanned outages often begin with smaller changes: one field sparks more frequently, outlet current stops following its usual pattern, or emissions rise after a process adjustment. For a dry electrostatic precipitator (ESP), those clues become useful when operators read them together rather than treating a single meter as a diagnosis.

The first troubleshooting question is whether the gas and dust entering the ESP have changed, or whether the precipitator itself has developed a problem. A field-by-field view of secondary current, secondary voltage, and spark rates helps narrow that answer before an outage forces the issue.

For a handy visual reference you can keep in your control room or maintenance shop, make sure to check out our free Precipitator Diagnostic Guides.

Reading Electrical Trends from Inlet to Outlet

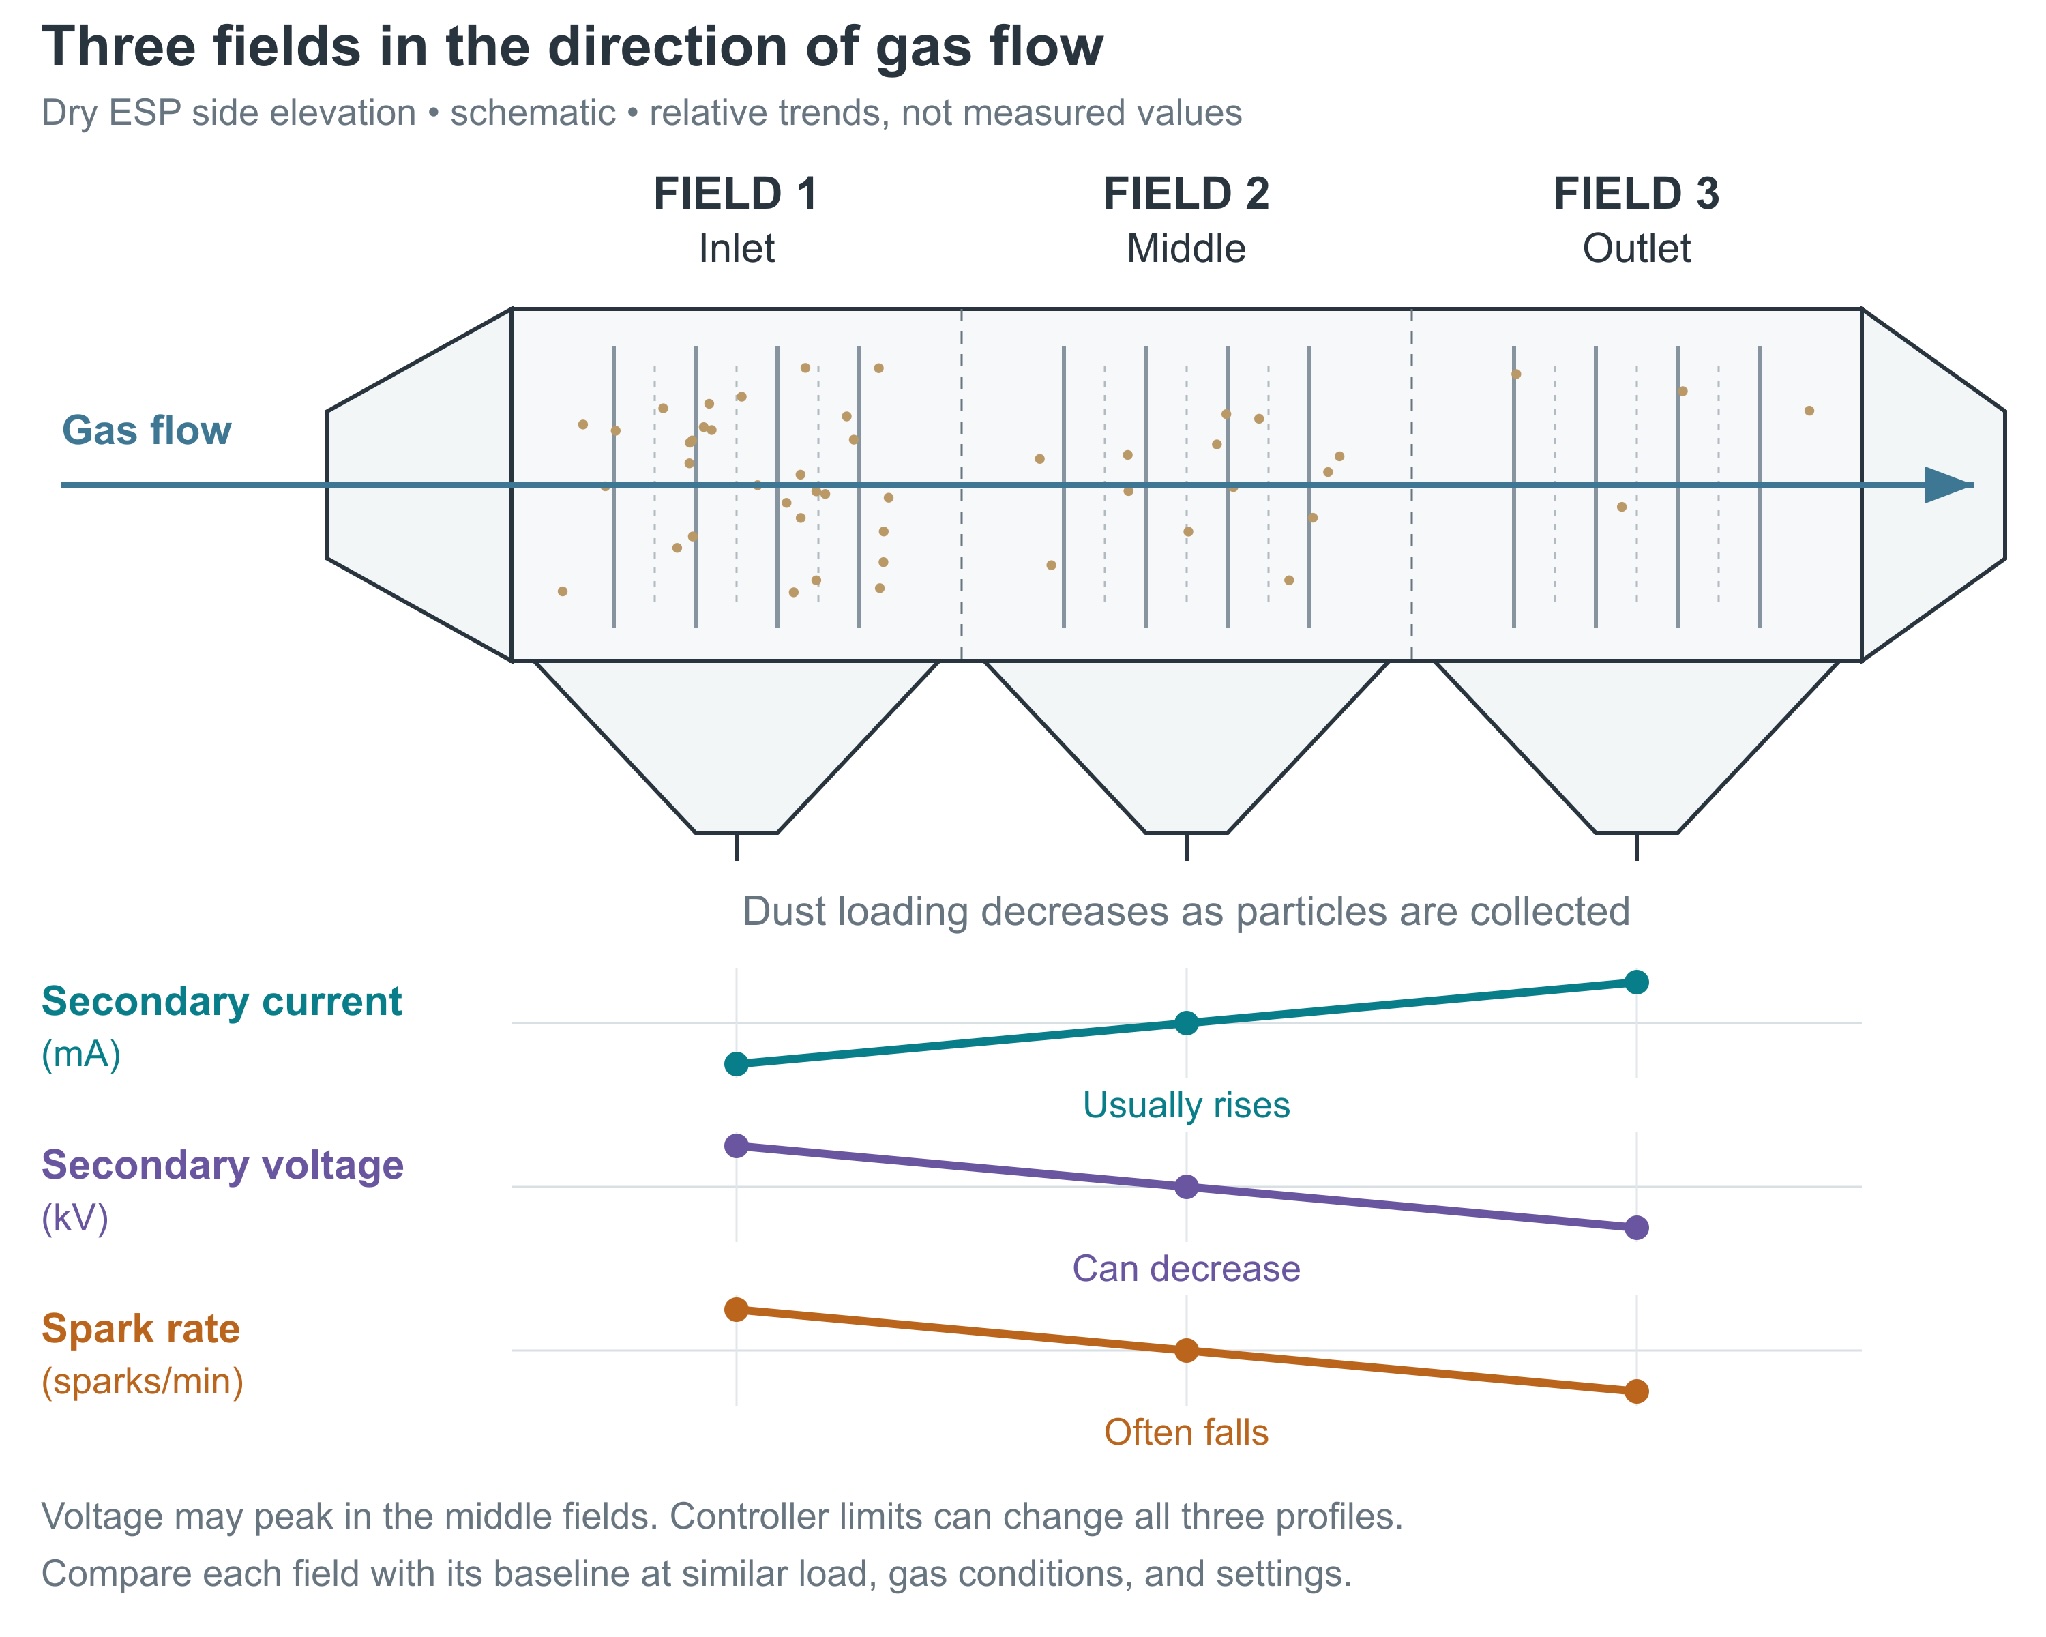
Arrange controller data in the actual gas-flow sequence, from inlet to outlet, for each chamber. Display secondary current in milliamps (mA), secondary voltage in kilovolts (kV), and actual sparks per minute on separate, aligned trends. Identify which fields are online and whether each controller is spark-limited, current-limited, voltage-limited, or manually restricted

https://www.neundorfer.com/wp-content/uploads/2026/10/NEUN-Gas-Flow-Image.jpg

Figure 1. Typical inlet-to-outlet relationships. The trend lines use separate qualitative scales; they are not operating targets.

  • Secondary Current: In many normally operating dry ESPs, the inlet field carries the lowest current. Its heavy dust loading captures ions and produces particle space charge that suppresses current. As upstream fields remove particles, current generally increases toward the outlet. An inlet reading below an outlet reading can therefore be normal; a new dip in one middle or outlet field deserves investigation. Compare current density when energized collecting areas differ, and account for T/R ratings and control settings.
  • Secondary Voltage: The inlet can operate at relatively high voltage while drawing less current. Cleaner gas downstream can carry more current at a lower voltage, so voltage does not have to rise toward the outlet. Some units show a gradual decline; others have a spark-limited inlet, higher middle-field voltage, and a modest outlet decline. The useful signal is a departure from that field’s normal profile under comparable conditions.
  • Spark Rates: Sparking is often more frequent in inlet fields and decreases toward the outlet, where controllers may reach a current limit before a spark limit. Check measured sparks, not just the programmed target. A newly elevated outlet spark rate, repeated voltage setbacks, or slower recovery can flag a change. There is no universal target spark rate: supply technology, settings, and gas conditions determine what is normal.

Read all three values together. Low inlet current with stable voltage and acceptable emissions may match the baseline. Low current plus falling voltage and rising sparks in one previously stable field is a different pattern. Likewise, low sparking is not proof of good performance if a field is underpowered, disabled, or held at a low controller limit.

Separating Process Influences from Precipitator Problems

Compare the spatial pattern and the timing of the change. Start with the same field at similar load, temperature, fuel or feed composition, and controller settings. Then compare equivalent fields in parallel chambers. A single snapshot can hide a short disturbance or make two different operating conditions look like equipment deterioration.

  • A Broad Change: When several fields or chambers change together, check plant load, gas flow, inlet temperature, oxygen, moisture, fuel or feed changes, combustion conditions, and conditioning or injection-system status where applicable. These can alter dust loading, particle properties, and electrical behavior without a mechanical change inside the ESP. Correlation makes a process influence more likely; it does not establish the cause by itself.
  • A Change That Follows the Gas Stream: An increase in inlet dust loading may suppress inlet current and affect successive fields as more dust carries downstream. A temperature or chemistry shift may change attainable voltage, current, and sparking across much of the unit. The response need not be identical in every field because dust loading and controller limits differ.
  • An Isolated Outlier: If one field repeatedly loses voltage or current while comparable fields remain stable, check its alarm history, limits, rapper operation, hopper evacuation, purge air, feedback signals, and high-voltage circuit. Persistent sparking at lower-than-normal voltage can point toward close clearances, deposits, or a moving electrode. The electrical pattern identifies a suspect location, not a confirmed component failure.
  • A Chamber Imbalance: If several fields in one chamber differ from their counterparts, investigate gas distribution, local air leakage, chamber dust loading, and shared equipment. A process influence can be uneven, and a shared purge-air or ash-handling failure can affect multiple fields. “Many fields” and “one field” are useful starting clues, not absolute rules.

For example, if current falls in several inlet fields just after a fuel change and begins recovering when conditions stabilize, investigate the process first. If only one middle field shows repeated spark bursts and voltage setbacks at steady load, prioritize that field. If an inlet field trips first and downstream current subsequently falls, the downstream response may reflect added dust loading from the failed field rather than separate faults.

Using V I Curves to Test the Pattern

Your precipitator’s Voltage-Current (V-I) characteristic curve is essentially its primary health diagnostic. By plotting applied voltage against resulting secondary corona current, you get a clear look at what is happening inside without having to shut down for an entry.

Keep clean-air load curves from planned outages and gas-load curves from stable operation. Compare like conditions: a cold, clean ESP and a hot, dust-laden ESP will have different characteristics. Clean-air tests help identify clearance and electrical issues, but do not prove that the unit will perform correctly under process gas conditions.

  • Early Sparking at Reduced Voltage: A field that sparks before reaching its previous voltage and current may have a clearance problem or deposits. Compare its curve with its own history and similar fields, then use targeted inspection to confirm the cause.
  • High Voltage with Very Low Current: Heavy dust loading can suppress current, especially at the inlet. A persistent isolated change may also indicate coated discharge electrodes, an open connection, or a measurement problem. Check process conditions, cleaning history, and electrical feedback before selecting a repair.
  • Voltage Collapse and a Trip: Near-zero voltage with a current surge or current-limit event before a trip can be consistent with a short or severe leakage. Once protection shuts the supply off, both readings may be zero. Review the sequence and trip code; zero readings alone do not distinguish a short from a disabled supply or loss of input power.

Connecting Electrical Data to Mechanical Warning Signs

Electrical trends become more useful when they line up with equipment events. Check these supporting signals before assuming that a controller adjustment will solve the problem.

  • Electrode Wear and Movement: Repeated spark bursts and voltage setbacks in one field can accompany a moving or damaged discharge electrode. Use the event history to target a planned internal inspection for electrode wear, alignment, and collecting-plate distortion.
  • Rapper Timing and Emissions Peaks: Align rapper commands and confirmed operation with electrical data and emissions, allowing for gas travel and monitor delay. Brief emissions peaks after rapping suggest re-entrainment. Progressive electrical deterioration without expected cleaning recovery may point to ineffective rapping or deposits. Confirm hardware operation before changing timing or intensity.
  • Hopper Ash Accumulation: Check level alarms, evacuation cycles, conveying equipment, and hopper temperatures. Ash accumulation can approach energized components and produce intermittent sparking or a ground fault. A rising level followed by local voltage collapse is a stronger clue than either event alone. Hoppers should discharge ash rather than serve as storage.
  • Insulator and Purge Air Conditions: Compare declining purge-air pressure or temperature with local electrical instability. Dirty or damp insulators can cause leakage and tracking. Low voltage is not unique to an insulator fault, so use purge-system alarms, electrical checks, and inspection to confirm the source.

Making Troubleshooting a Routine

Use synchronized trend data to review the event before, during, and after the first deviation. Include electrical readings, actual spark rates, controller modes and limits, trips, process conditions, emissions, rapper activity, and hopper and purge-air status. Validate suspect measurements before making conclusions from them.

Set alerts around each field’s established operating range under comparable conditions. During planned outages, use the trend history and clean-air tests to focus inspections and compare results before and after repairs. Restore operation and verify both the electrical profile and emissions response; improved meter readings alone do not establish improved collection.

The goal is to identify what changed, where it changed, and which event came first. That approach helps operators distinguish a process disturbance from a precipitator problem and direct maintenance toward the cause before it becomes an outage.

Contact us at Neundorfer to learn more about diagnosing your electrostatic precipitator or optimizing your predictive maintenance strategy.

From Our Optimized Insights

Latest Insights

  • News Article

    2025: A Year of Milestones, Momentum, and Gratitude

    As we reach the close of 2025, I want to take a moment to reflect on the progress we’ve made together during a year filled with meaningful achievements and important transitions. First, I’m proud to share that we completed another year with zero safety incidents. Safety is…

  • News Article

    Celebrating 50 Years of Neundorfer!

    This year marks a milestone: Neundorfer’s 50th Anniversary. For half a century, we’ve been driven by innovation, collaboration and a commitment to helping our partners solve complex challenges in smarter, more sustainable ways. In August, we gathered with employees, partners, and friends to celebrate this achievement.

  • News Article

    2024 in Review: Success, Sustainability, and Milestones

    2024 in Review: Success, Sustainability, and Milestones As the year draws to a close, I want to take a moment to reflect on the successes we’ve achieved and the milestones we’ve reached together. This has been a remarkable year—one that saw us successfully complete numerous…